


Okay, so since last week’s blog the markets have been going one way and one way only – and it’s not North! So all of this stuff is timely. Thank goodness you read last week’s blog and now are not panicking, as you understand this is a temporary decline that’s part of an overall permanent advance. If you didn’t, what are you waiting for? Go and read this one first.
Timing the market? Should I get out my stopwatch?
Alright, first let’s look at what we mean by “market timing” and why it can seem like such a logical step to take when markets temporarily correct*.
Market timing means temporarily disinvesting your assets or holding back assets in cash with the aim of reinvesting when the market has dropped and/or “hit the bottom”. On the face of it seems so simple, so… logical: “If I miss all the bad days in the market my fund will never drop in value and I’ll only stay in for the good days”. Right? Alas, if only it were that simple.
I’m going to go through a number of different graphs in this blog to highlight a number of key concepts:
- Market returns are random and unpredictable
- Markets go up more often than not, so by trying to skip the bad days you risk missing the good days
- So long as you capture the good days, everything will turn out fine
Buckle in, we’re bringing in the stats.
Fooled by randomness
Take a look at this frankly chaotic chart:
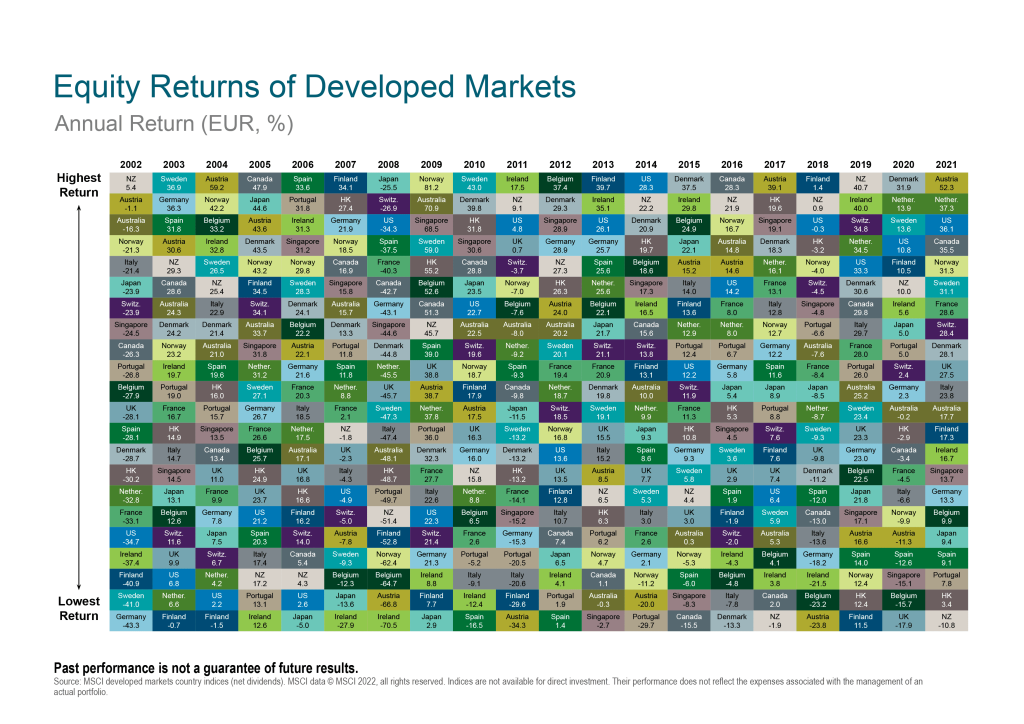
This chart maps the randomness of developed world equity returns since 2002 by region. Each region is colour coded and on first inspection, it’s clear that there is no discernible pattern here. It’s more like a patchwork quilt. There’s simply no possible way of knowing or predicting where returns are going to come from or which regions are going to underperform ahead of time.
Remember, when you try to time the market you have to get it right twice: once on the way in and once on the way out. Then you have to keep doing it for the next 40-odd years of your investing life. I’m not sure I like those odds looking at the randomness of these returns.
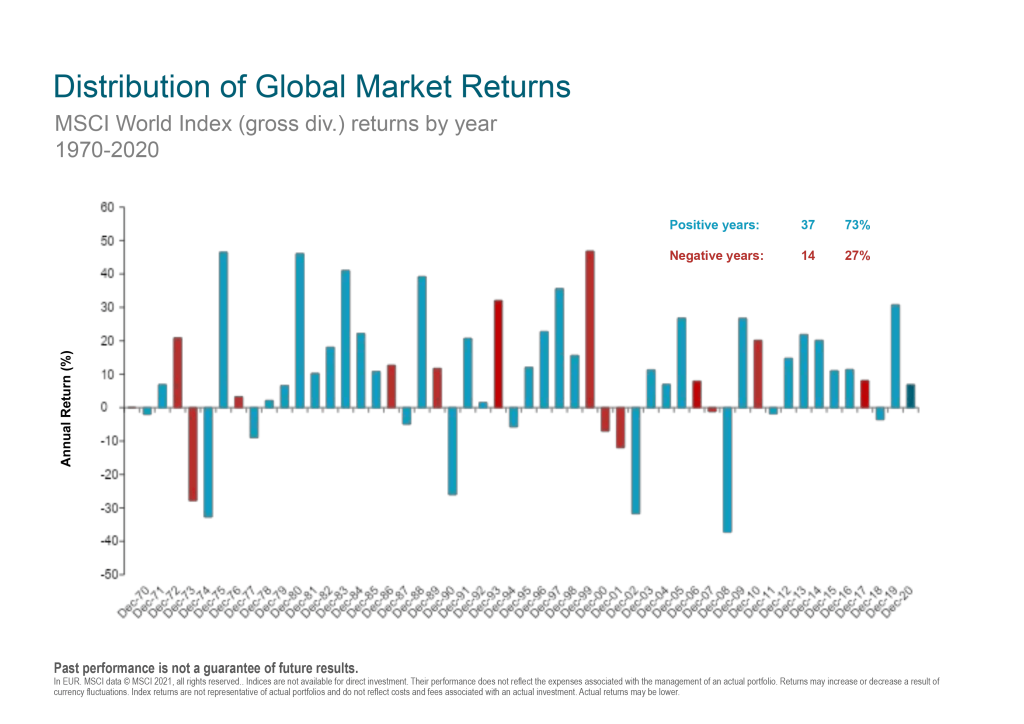
Declines are par for the course
This graph shows the global stock market returns from 1970-2020. Overall, markets have gone up on a calendar year basis 73% of the time. This means market timers would have to be practically clairvoyant to predict when to get in and when to get out of the market. Meanwhile, those who invested on a rolling monthly basis got it right 73% of the time. It’s kind of a no-brainer at this point.
Even though Markets do go up about 73% of the time, the average decline in any given year can still be quite substantial. The chart below looks at the annual return of US stocks since 1979.
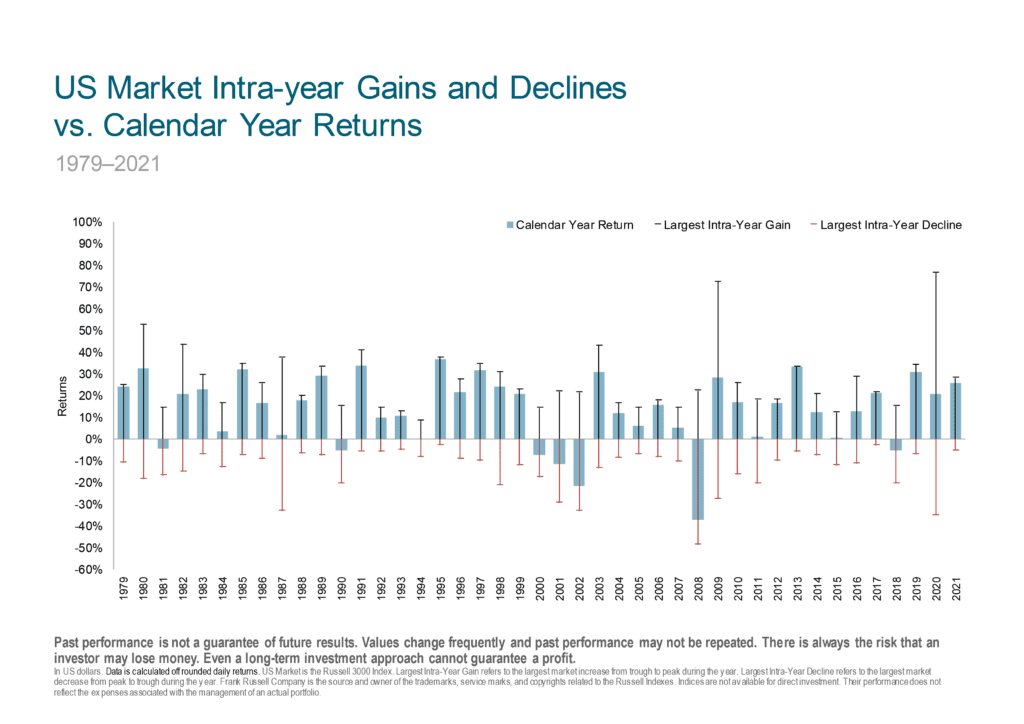
The blue-grey bars are all the years with a positive return Jan to Dec (it’s pretty much all of them) but the black lines show the intra-year peak to trough. In every single year since 1979, the market was showing a negative return for that given year at least once in that 12 month period. Think of all the opportunities market timers would have had to try to make a prediction, whilst the investors who lived in a cave with their fingers in their ears captured the long term returns with almost no risk of mistiming the market. There’s a solid reason we harp on about how you should #StickWithThePlan and ignore the sensationalists.
Timing is(n’t) everything
The chart below is the real proof why you don’t need to time the market and just focus on the long term.
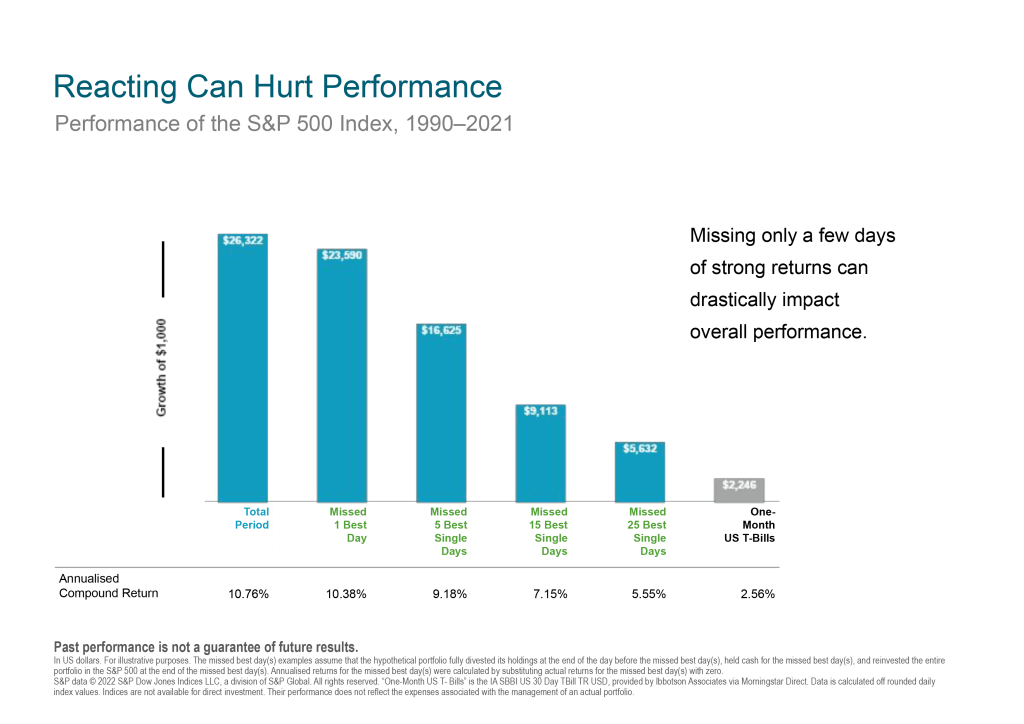
The first bar shows the growth of $1,000 from 1990-2021. The people who invested, did nothing, and just tracked the market ended up with a 10.76% annualised return. However, the next bar to the right shows the effect of missing the single one best day in a 31-year period. It would have cost you almost $2,700. If you missed the best 5 days it would have cost you nearly $10,000 or 40% of your overall return. Doesn’t that make you feel a little sick to your stomach?
So what should I do?
Bad days are going to happen. That’s just a fact. They will not be pleasant. However, if you understand that your job is only to ensure that you capture all the good days, then staying invested at all times becomes essential. The risk of leaving the market or sitting in cash even just for one day can have a dramatic effect on your portfolio. If you focus on the long term, capture all of the good days, then the bad days won’t have a long-term effect on you.
Next week I’ll be taking a brief interlude from the basics and principles of investing to focus on something a bit more topical: ethical and sustainable investing and what you need to be aware of.
Cian Callaghan is the Head of Financial Planning and a Private Client Manager at Metis Ireland.
____
*Market correction: a sustained decline in the value of a market index or the price of an individual asset. A correction is generally agreed to be a 10% to 20% drop in value from a recent peak.
Disclaimer
Metis Ireland Financial Planning Ltd t/a Metis Ireland is regulated by the Central Bank of Ireland.
All content provided in these blog posts is intended for information purposes only and should not be interpreted as financial advice. You should always engage the services of a fully qualified financial adviser before entering any financial contract. Metis Ireland Financial Planning Ltd t/a Metis Ireland will not be held responsible for any actions taken as a result of reading these blog posts.
